
Create cloud system architecture diagrams without using any design tool
Unlock the power of creating diagrams as code in the era of DevOps and DevSecOps. Learn how tools like "Diagrams" can help you collaborate, track changes, identify problems, and create consistent and up-to-date system architecture representations.
In the era of DevOps and DevSecOps, from infrastructure to application configuration, everything is being developed as code. This approach enables us to use a declarative approach as we have been using it for software development.
One diagram can be worth more than a thousand words. Creating diagrams is one of the important communication skills of a software engineer or architect. Instead of writing lengthy documentation and presentations, take the time to create representations of solutions. Create diagrams in a way that can be used across many projects like we have been doing in software development. So, as we are in the era of Everything as Code, do it that way.
How important is it to create your diagram as code? You might ask.
Creating a diagram as code can be similar to software development. It can help you to keep your diagrams updated as your system grows, but these reasons may be why it can be more helpful:
- First, and most importantly, it gives you the chance to collaborate using the same tools software developers have been using.
- I'd like to make this part of an integral part of the system and keep maturing it along with software. That way, after a few years, the diagram will reflect all the latest improvements along with software and infrastructure.
- Keep track of changes on any version control system.
- and it can help identify the solution problems, design bottlenecks, or bugs in the code review process of the diagram.
Diagrams is the tool that lets you draw a cloud system architect in Python code. As per the author, its main focus was to create a prototype new system architect design without any design tools.
Note! It only contains code for drawing cloud system architecture diagrams and does not control any terraform or cloud template to manage your cloud resources.
"Diagrams" can be used to create cloud system architect diagrams for AWS, Azure, GCP, on-premise, Kubernetes, Alibaba Cloud, and Oracle Cloud.
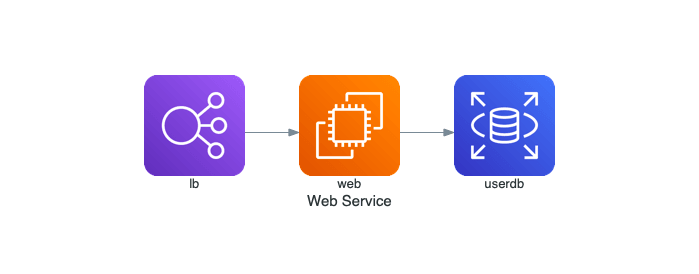
There are installation instructions available from the documentation of Diagrams but I prefer to run it as a Docker container, Here is the quick start example of the diagram from the documentation.
from diagrams import Diagram
from diagrams.aws.compute import EC2
from diagrams.aws.database import RDS
from diagrams.aws.network import ELB
with Diagram("Web Service", show=False):
    ELB("lb") >> EC2("web") >> RDS("userdb")
This is the non-docker command to generate a diagram if you have installed it using pip.
python example-1.pyand this is the docker command that generates the diagram.
cat example-1.py | docker run -i --rm -v $(pwd)/out:/out kalemena/mingrammer-diagrams:0.20.0It will be saved as web_service.png in your $(pwd)/out directory.
You can explore more similar examples on the examples page.
💡 I would suggest you watch a presentation of "Scaling up to Your First 10 Million User" from AWS where they showcase this library in a more appropriate approach.
In one of my microservices-based projects, we used mono-repo and all of the services represented a single responsibility. At that time, Golang and Nodejs were the only two languages that were part of the tech stack for software development.
We wanted to achieve two things: First, every service should have its own diagram that is consistent with other diagrams and discusses what dependency it uses, what third party and internal communication hierarchy is, and how it communicates with other components such as database and Redis cluster. Also, what component/properties does it have (for example Prometheus metrics for monitoring, logging and HA setup, resources size)?
Second, as for the new service, I want to make sure it's documented in the global infrastructure presentation. Whenever a new service graduate is part of the production fleet, we update the global diagram to reflect the current state of graduated services. For example, where they're deployed, what cluster or region/AZ they belong to, and what their communication metrics are.
There are other tools available that can be used with a similar mindset. These include PlantUML - UML Diagrams and Draw.io - Flexible Diagrams.
PlantUML has a language to write the diagram and there is a VS Code extension that can show the UML diagram output in VS Code. Learning new syntax and language has its own learning curve. This sometimes leads to less adoption of tools in the team.
On the other hand, Draw.io. A lot of people feel comfortable creating diagrams in it because it provides a lot of shapes that help to create a diagram with more control where required. Draw.io VS Code extension allows you to make Draw.io files part of the project where it can also be part of the version control system.
At the beginning of a project, it might be more suitable to use Draw.io due to the short amount of time, but not every team member will have the same hands-on experience with design tools. Newly onboard architects or resources might feel uncomfortable working on old diagrams as the previous resources didn't manage them properly or for any reason.
But with “Diagrams,” as it is Python code, everyone who is familiar with Python can work on it and make it more mature as suits the project’s needs over time. If you're interested in learning more about this library, here's some more information about it Diagrams.
#process-automation #diagrams-as-code #system-architecture-design
To make your reading time worthwhile, go to my blog Simplifying Kubernetes Secrets Management with External Secrets
Hi! I am Safoor Safdar a Senior SRE. Read More. Don't hesitate to reach out! You can find me on Linkedin, or simply drop me an email at me@safoorsafdar.com