
End-to-End MongoDB Monitoring on Kubernetes: Integrating with Grafana Cloud for Comprehensive Insights
Integrating MongoDB with Grafana Cloud offers a robust monitoring solution that empowers modern applications. With Grafana Cloud's powerful features, you can gain valuable insights into your MongoDB deployment, effectively troubleshoot performance issues, and optimize resource utilization.

As a DevOps professional, I understand the importance of effective monitoring and visualization in the cloud era. To ensure optimal performance and gain valuable insights into MongoDB, integrating it with Grafana Cloud is a powerful solution. In this article, I will guide you through the process of setting up the MongoDB integration and exploring its features, so that you can enhance your monitoring capabilities.
Understanding the Current MongoDB Deployment
Before diving into the integration process, it's crucial to have a clear understanding of your MongoDB deployment. Ensure that you have a running MongoDB instance with a configured user and password. It is highly recommended to create a separate user for the Agent, granting it only the necessary security privileges for monitoring your node.
A MongoDB deployment can take different forms based on the needs of the application. It can be a standalone setup for development or small-scale use, a replica set configuration for high availability and automatic failover, or a sharded cluster for large-scale applications. Deployments can be scaled horizontally or vertically to handle increased data volumes and traffic. Security considerations, such as authentication, encryption, and access control, are crucial aspects of any MongoDB deployment.
Refer to the official MongoDB documentation for detailed instructions on setting up user permissions.
Now, let's dive into the deployment process. In this section, I will walk you through the steps to create a Grafana Cloud account and deploy a MongoDB database using MongoDB Atlas.
Now, let's dive into the deployment process. In this section, I will walk you through the steps to create a Grafana Cloud account and deploy a MongoDB database using MongoDB Atlas.
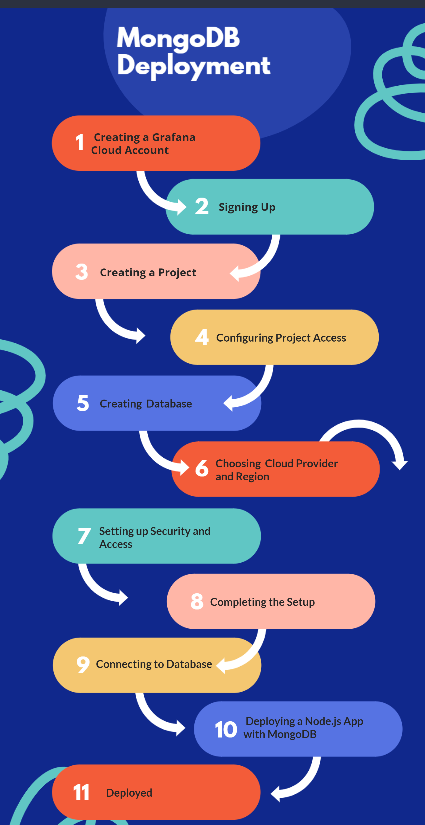
Step 1: Creating a Grafana Cloud Account
To get started, go to the Grafana Cloud website at https://grafana.com/cloud/ and click on the "Get Started for Free" button. This will take you to the account creation page.
Step 2: Signing Up or Signing In
On the account creation page, you will be prompted to either sign up or sign in. If you already have a Grafana Cloud account, you can sign in using your credentials. Otherwise, click on the "Sign Up" button to create a new account. You may also have the option to sign up using your Google account for convenience.
Step 3: Creating a Project
Once you have signed in or created a new account, you will be taken to the Grafana Cloud dashboard. Here, you can create a new project by clicking on the "New Project" button. Give your project a meaningful name that reflects its purpose.
Step 4: Configuring Project Access
After creating a project, you will be prompted to configure project access. You can grant access to existing users or add new users to your project. This step allows you to control who can access and manage your MongoDB database.
Step 5: Creating a Database
With the project set up, you can now create your MongoDB database. Click on the "Build a Database" button to proceed. Grafana Cloud offers different options for database deployment, including shared servers and dedicated servers. Choose the option that best suits your needs. For testing purposes, you can start with a shared server, which is free.
Step 6: Choosing a Cloud Provider and Region
Next, you will be prompted to choose a cloud provider and region for your MongoDB server. It is recommended to select a region that is closest to your user base to minimize latency. Click on the "Create Cluster" button to proceed.
Step 7: Setting up Security and Access
In this step, you will need to provide a username and password for your MongoDB database. Make sure to choose a strong password and keep it secure. You will also need to specify the IP address for your testing project. Click on the "Create User" button to proceed.
Step 8: Completing the Setup
After setting up security and access, you will see a summary of your database configuration. Review the details and click the "Finish and Close" button to complete the setup process.
Step 9: Connecting to the Database
Once the database setup is complete, you will be taken to the cluster overview page. Here, click on the "Connect" button to obtain the connection string for your MongoDB database. This connection string will be used to connect your Node.js application to the database.
Step 10: Deploying a Node.js App with MongoDB
Now that you have the connection string, you can deploy a Node.js app that connects to your MongoDB database. Start by creating a new folder for your app and navigating to it in the command line. Use the command npm init -y to initialize a new Node.js project.
Next, install the required dependencies for your app. In this case, you will need the mongoose and express packages. Mongoose is a powerful npm module that allows you to connect your Node.js app to a MongoDB database, while Express simplifies the process of building web applications with Node.js.
npm install mongoose express
With the dependencies installed, create a new file named server.js in your project directory. This file will contain the code to connect your Node.js app to the MongoDB database. Open server.js in your favorite code editor and add the following code:
const mongoose = require('mongoose');
const express = require('express');

const app = express();

// Connect to MongoDB
mongoose.connect('<your-connection-string>', { useNewUrlParser: true, useUnifiedTopology: true })
  .then(() => {
    console.log('Connected to MongoDB');
    // Start the server
    app.listen(3000, () => {
      console.log('Server is running on port 3000');
    });
  })
  .catch((error) => {
    console.error('Failed to connect to MongoDB', error);
  });
Replace <your-connection-string> with the actual connection string obtained from Grafana Cloud. This code establishes a connection to the MongoDB database and starts a server on port 3000 to listen for incoming requests.
Step 11: Deployed
Save the server.js file and return to the command line. Run the following command to start your Node.js app:
node server.js
If everything is set up correctly, you should see the messages "Connected to MongoDB" and "Server is running on port 3000" in the console. Congratulations! Your Node.js app is now connected to your MongoDB database deployed with Grafana Cloud.
Setting Up MongoDB for Monitoring
To enable monitoring of your MongoDB setup, you need to configure the Grafana Agent to send metrics to your Grafana Cloud instance. The integration relies on themongodb_exporter, which is embedded in the Grafana Agent. Let's go through the steps to install and configure the MongoDB integration.
- In your Grafana Cloud stack, navigate to Connections in the left-hand menu.
- Locate the MongoDB tile and click on it to open the integration.
- Review the prerequisites mentioned in the Configuration Details tab.
- Install the integration by following the instructions provided. This will add pre-built dashboards and alerts to your Grafana Cloud instance.
Creating the Service Monitor
To enable the MongoDB integration, you need to add a configuration snippet to the Grafana Agent's configuration file. This snippet includes the necessary relabel_configs and custom labels required for this integration. Here's an example of the configuration snippet:
integrations:
  mongodb_exporter:
    enabled: true
    mongodb_uri: mongodb://mongodb:27017
    relabel_configs:
    - target_label: service_name
      replacement: 'mongodb'
    - target_label: mongodb_cluster
      replacement: 'your-cluster-name'
    - target_label: instance
      replacement: "<your-instance-name>"
Ensure that you update the values in the snippet according to your environment. The mongodb_uri should reflect the connection details of your MongoDB instance. The service_name and mongodb_cluster labels help identify your node in the cluster, while the instance label allows you to specify a custom name for the instance.
For a comprehensive description of all configuration options, refer to the agent documentation's guide on configuring the mongodb_exporter_config block.
Exploring the MongoDB Integration in Grafana Cloud
The MongoDB integration in Grafana Cloud offers several key features to monitor and visualize MongoDB metrics effectively. Here are some of the notable features:
| Key Features | Description |
|---|---|
| Data Source Configuration | Configure MongoDB as a data source within Grafana Cloud. Provide connection details and authentication credentials. |
| Querying and Visualization | Write MongoDB queries using MQL in Grafana Cloud. Visualize data with various charting options like line graphs, bar charts, and tables. |
| Pre-built Dashboards | Access a collection of pre-built MongoDB dashboards in Grafana Cloud. Monitor and visualize essential metrics and performance indicators. |
| Metrics and Monitoring | Monitor various MongoDB metrics, including database operations, resource usage (CPU, memory, disk), network activity, and replication lag. |
| Alerting and Notifications | Set up alerts based on MongoDB metrics. Define alert conditions and thresholds, receive notifications via email, Slack, PagerDuty, etc. |
| Anomaly Detection | Utilize Grafana Cloud's anomaly detection to identify unusual behavior or deviations from normal patterns in MongoDB metrics. |
| High Availability and Scalability | Grafana Cloud's MongoDB integration is designed to handle large-scale deployments, supporting high availability setups for monitoring single replica sets or sharded clusters. |
Dashboards
The MongoDB integration installs three pre-built dashboards in your Grafana Cloud instance:
- MongoDB Cluster: This dashboard provides an overview of your MongoDB cluster, including key metrics related to cluster status, latency, and replication.
- MongoDB Instance: This dashboard focuses on individual MongoDB instances, providing detailed insights into metrics such as memory usage, connection counts, and cursor behavior.
- MongoDB ReplicaSet: This dashboard is specifically designed for MongoDB ReplicaSets, offering metrics related to replication lag, oplog, and member status.
Each dashboard is meticulously designed to present the most relevant metrics and visualizations for effective monitoring of your MongoDB deployment.
Alerts
The MongoDB integration comes with a set of useful alerts that help you proactively identify and address potential issues. Here are some of the key alerts included:
- MongodbDownCritical: This alert triggers when a MongoDB instance goes down, indicating a critical issue that requires immediate attention.
- MongodbReplicationLagCritical: When the replication lag exceeds a defined threshold, this alert notifies you about potential replication delays.
- MongodbReplicationHeadroomCritical: This alert helps you monitor the headroom available for replication, ensuring that it doesn't exceed specified limits.
- MongodbNumberCursorsOpenWarning: If the number of open cursors reaches a high level, this alert raises a warning to prevent cursor exhaustion.
- MongodbCursorsTimeoutsWarning: This alert detects if MongoDB cursors are timing out frequently, indicating potential performance issues.
- MongodbTooManyConnectionsWarning: When the number of connections to MongoDB exceeds a recommended threshold, this alert helps you identify potential bottlenecks.
- MongodbVirtualMemoryUsageWarning: This alert monitors the virtual memory usage of MongoDB, providing insights into resource utilization.
These alerts enable proactive monitoring and timely response to ensure the smooth operation of your MongoDB deployment.
Conclusion
Integrating MongoDB with Grafana Cloud provides a comprehensive monitoring solution for modern applications. By leveraging the powerful features of Grafana Cloud, you can gain valuable insights into your MongoDB deployment, identify performance issues, and ensure optimal resource utilization. With pre-built dashboards, alerts, and a wide range of metrics, you can proactively monitor and visualize your MongoDB metrics, empowering you to make data-driven decisions and ensure the smooth operation of your applications. Start harnessing the power of Grafana Cloud and MongoDB integration today to unlock the full potential of your database deployment.
If you have just started on Grfana, check my blog Getting Started with Grafana Cloud for Kubernetes
Hi! I am Safoor Safdar a Senior SRE. Read More. Don't hesitate to reach out! You can find me on Linkedin, or simply drop me an email at me@safoorsafdar.com