Getting started with Grafana Cloud for Kubernetes
Maximize your Kubernetes potential with Grafana Cloud's monitoring guide. Get better control and insight with an all-in-one solution. Ensure seamless and efficient Kubernetes performance for success.

Basic Understanding of Grafana Agent Operator For Kubernetes
- Architectural Insights: Grafana Operator for Kubernetes Clusters
- Custom Resource Hierarchy in Grafana Agent Operator
Install the Grafana Agent Operator in your Kubernetes
- Step 1: Adding the Grafana Helm Repository
- Step 2: Updating Helm Repositories
- Step 3: Installing the Grafana Agent Operator
- Step 4: Verifying the Installation
Configure The Kubernetes Solution on Grafana Cloud
- Selecting a Kubernetes Monitoring Approach
- Installing a Kubernetes Integration
- Reinstalling or Upgrading Kubernetes Monitoring
Review The Available Grafana Dashboard For Kubernetes Integration
- Explore Dashboard Categories
- Select and Customize Dashboards
Exploring Available AlertManager Alerts for Kubernetes Monitoring
- Explore Alert Categories
- Customize and Manage Alerts
Grafana Cloud Cost Overview
Conclusion
Are you struggling to effectively monitor your Kubernetes clusters and gain valuable insights into their performance? Look no further than the Grafana Kubernetes Operator. In this blog, you will learn its basic principles, architectural insights, and how it seamlessly integrates with Grafana to provide a comprehensive monitoring solution.
Additionally, you will also learn to enable the Kubernetes solution on Grafana Cloud, explore Grafana dashboards for Kubernetes integration, explore alertmanager alerts, and gain insights into the cost structure of Grafana Cloud.
Basic Understanding of Grafana Agent Operator For Kubernetes
Architectural Insights: Grafana Operator for Kubernetes Clusters
The Grafana Operator for Kubernetes clusters is a powerful tool that enables monitoring using Grafana Agent. It operates by monitoring Kubernetes custom resources, which define how telemetry data is collected and directed. By watching for changes in these resources, the operator efficiently manages Grafana Agent deployments in your cluster.
Custom Resource Hierarchy in Grafana Agent Operator
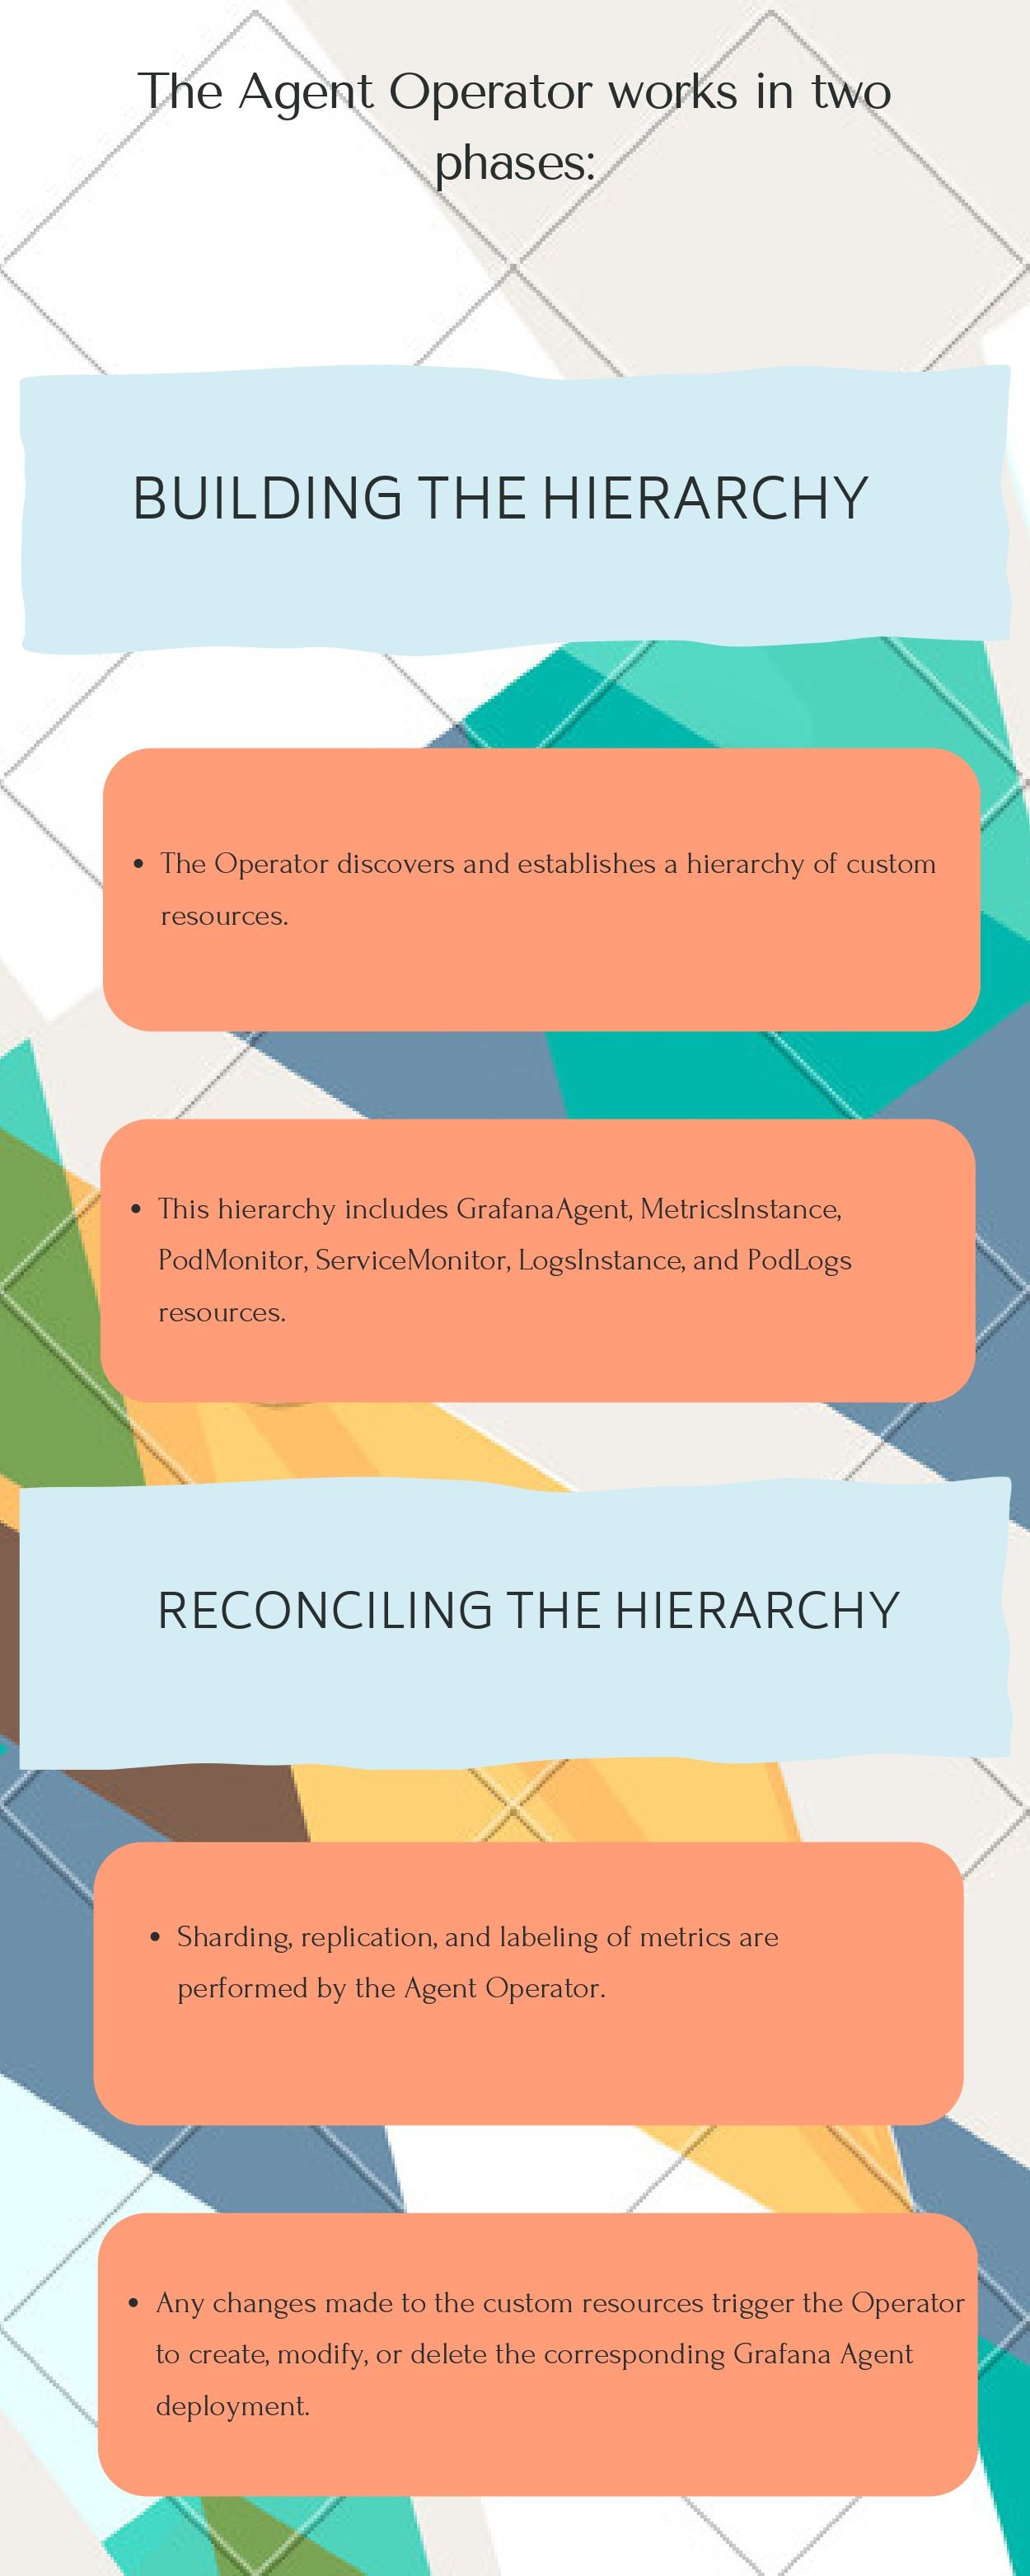
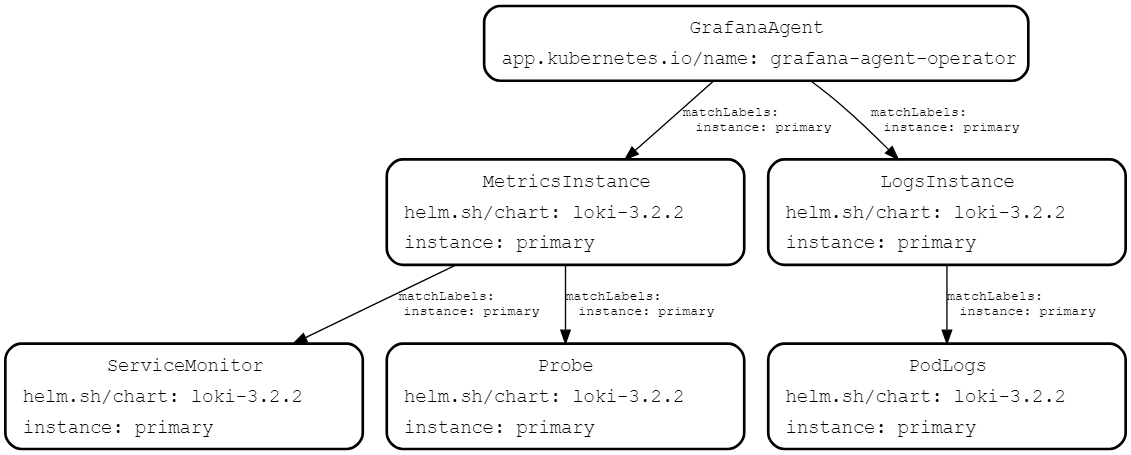
The Grafana Agent Operator follows a custom resource hierarchy to manage and configure the deployment of Grafana Agent within a Kubernetes cluster. This hierarchy consists of several custom resources that interact with each other. Let's explore this hierarchy in detail:

GrafanaAgent:
- The GrafanaAgent resource is the root of the custom resource hierarchy.
- It acts as the primary resource that the Agent Operator looks for.
- GrafanaAgent resource defines the attributes for Pods, such as requests, limits, affinities, tolerations, and the Grafana Agent image.
- These Pod attributes defined at the GrafanaAgent level are propagated to MetricsInstance and LogsInstance Pods.
MetricsInstance:
- MetricsInstance is a sub-resource of GrafanaAgent.
- It specifies the destination where the collected metrics should be shipped.
- It creates a Grafana Agent StatefulSet responsible for scraping and sending metrics to a remote_write endpoint.
PodMonitor:
- PodMonitor collects cAdvisor and kubelet metrics.
- It is configured within the MetricsInstance/Agent StatefulSet.
Probe:
- The probe is another sub-resource that can be referenced by GrafanaAgents.
- Multiple GrafanaAgents can use the same Probe configuration.
- Modifying the Probe resource triggers the reconciliation of all the associated GrafanaAgents.
ServiceMonitor:
- ServiceMonitor is responsible for collecting metrics related to services.
- It configures the MetricsInstance/Agent StatefulSet.
LogsInstance:
- LogsInstance defines the destination for collected logs.
- It rolls out a Grafana Agent DaemonSet that tails log files on the cluster nodes.
PodLogs:
- PodLogs collects container logs from Kubernetes Pods.
- It is configured within the LogsInstance/Agent DaemonSet.
The custom resource hierarchy allows for referencing ConfigMaps or Secrets, which can be added to the resource hierarchy.

Install the Grafana Agent Operator in your Kubernetes
The Grafana Agent Operator is a powerful tool that simplifies the monitoring of Kubernetes clusters using Grafana Agent. By leveraging Helm, a popular package manager for Kubernetes, you can easily deploy the Grafana Agent Operator in your cluster. Let's walk through the installation process step by step:
For this let's take this example 👇
helm repo add grafana https://grafana.github.io/helm-charts
helm repo update
helm install grafana-agent-operator grafana/grafana-agent-operator -n monitoring
kubectl get po -n monitoring
What I do here? explained 👇
Step 1: Adding the Grafana Helm Repository
First, you need to add the Grafana Helm chart repository to your local Helm configuration by executing the following command in your terminal: helm repo add grafana https://grafana.github.io/helm-charts.
This command adds the repository that contains the necessary charts for installing the Grafana Agent Operator.
Step 2: Updating Helm Repositories
Next, update your Helm repositories to ensure you have the latest available charts and their versions. Use the command helm repo update to fetch the latest information from the added repositories, including the Grafana repository.
Step 3: Installing the Grafana Agent Operator
Once the repositories are updated, you can proceed to install the Grafana Agent Operator in your Kubernetes cluster. Use the command helm install grafana-agent-operator grafana/grafana-agent-operator -n monitoring to specify the chart name, repository, and installation namespace. Replace monitoring with your desired namespace if needed.
Step 4: Verifying the Installation
After executing the Helm command, the Grafana Agent Operator will be installed in your Kubernetes cluster. To verify the installation, use the command kubectl get po -n monitoring to list all the pods in the monitoring namespace. You should see the Grafana Agent Operator pod among them.
Ensure that you have a monitoring namespace in your cluster or install it in your desired namespace to complete the installation and verification process.
Configure The Kubernetes Solution on Grafana Cloud
To efficiently monitor the health and performance of your Kubernetes clusters, Grafana Cloud offers a robust Kubernetes Monitoring solution. By following these steps, you can easily configure the monitoring setup and take advantage of preconfigured dashboards, alerts, and integrations.
Selecting a Kubernetes Monitoring Approach
Before getting started, it's important to choose the right approach for Kubernetes Monitoring. Grafana Cloud provides two options:
1. Configure Kubernetes Monitoring using Grafana Agent: This approach utilizes Grafana Agent, a lightweight data collection agent, to scrape metrics from your Kubernetes cluster. It provides a simple and efficient way to collect and send telemetry data to Grafana Cloud.
2. Configure Kubernetes Monitoring using Grafana Agent Operator: The Grafana Agent Operator offers an operator-based approach to managing and deploying Grafana Agents within your Kubernetes cluster. It provides enhanced flexibility and control over the monitoring setup.
Installing a Kubernetes Integration
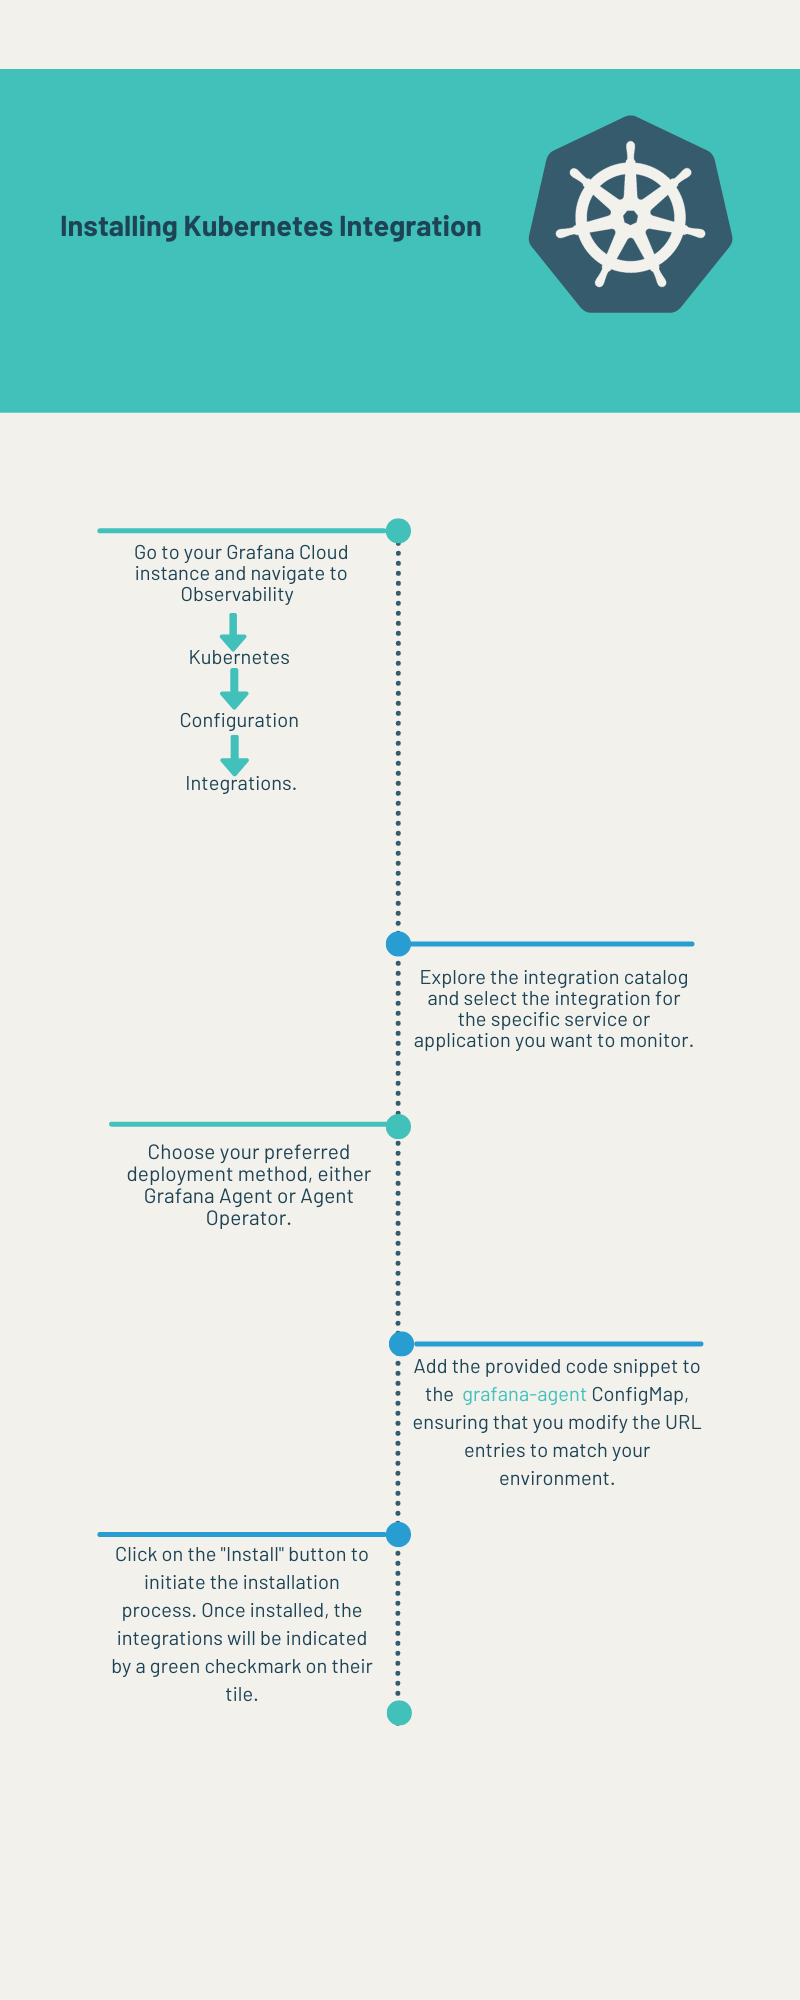
To begin monitoring your Kubernetes cluster, you need to install a Kubernetes integration in Grafana Cloud. Here's how

In case the desired integration is not available in the catalog, Grafana Cloud allows you to configure custom integrations using embedded Agent exporters and integrations. Refer to the integrations_config documentation for detailed instructions on manual configuration.
Reinstalling or Upgrading Kubernetes Monitoring
To ensure you benefit from the latest updates and improvements in Grafana Agent, dashboards, alerting rules, recording rules, kube-state-metrics, and Kubernetes manifests, it is crucial to regularly update these components. Here's a quick guide on how to reinstall or upgrade your Kubernetes Monitoring components:
- Manual Updates: Grafana Agent, dashboards, alerting rules, recording rules, kube-state-metrics, and Kubernetes manifests require manual updates to stay up to date.
- Refer to the Documentation: You can access documentation on updating Kubernetes Monitoring components to find detailed instructions for each component.
- Follow the Instructions: Follow the provided instructions to perform the necessary steps for reinstalling or upgrading the specific component you want to update.
Review The Available Grafana Dashboard For Kubernetes Integration.
When it comes to monitoring Kubernetes clusters, Grafana Cloud provides a wide range of preconfigured dashboards that offer comprehensive insights into the health, performance, and resource utilization of your Kubernetes environment. Let's review the available Grafana dashboards for Kubernetes integration and how they can help you visualize and analyze your cluster metrics.
To access and navigate the Kubernetes monitoring dashboards in Grafana Cloud, follow these steps:
- Login to Grafana Cloud: Log in to your Grafana Cloud instance to access the Grafana dashboard interface.
- Navigate to Kubernetes Monitoring: Once logged in, navigate to the Kubernetes Monitoring section, which may be found under the "Observability" or a similar menu.
- Select Dashboards: Within the Kubernetes Monitoring interface, you will find a collection of preconfigured dashboards tailored specifically for Kubernetes. These dashboards cover various aspects of your cluster's performance and resource utilization.
Explore Dashboard Categories
The available dashboards are organized into different categories based on the metrics they visualize. Some common categories may include:
- Cluster Overview: Provides an overall view of your Kubernetes cluster's health and resource usage, including CPU, memory, and network metrics.
- Node Monitoring: Focuses on individual nodes within your cluster, allowing you to analyze metrics such as CPU usage, memory consumption, and disk utilization on a per-node basis.
- Pod Monitoring: Offers insights into the performance and resource utilization of pods running in your cluster, including CPU, memory, and network metrics.
- Workload Analysis: Provides deeper visibility into specific workloads, such as deployments, stateful sets, or daemon sets, helping you understand their performance and resource utilization.
Select and Customize Dashboards
You can browse through the available dashboards within each category and select the ones that align with your monitoring requirements. Once selected, you can customize the dashboards to focus on specific namespaces, services, or labels based on your cluster setup.
Exploring Available Alertmanager Alerts for Kubernetes Monitoring
In addition to preconfigured dashboards, Grafana Cloud offers a comprehensive set of alertmanager alerts specifically designed for Kubernetes monitoring. These alerts enable you to proactively detect and respond to potential issues or anomalies in your Kubernetes clusters. Let's review the available alertmanager alerts and understand how they can help you ensure the stability and reliability of your Kubernetes environment.
To access and manage the alertmanager alerts in Grafana Cloud for Kubernetes monitoring, follow these steps:
- Login to Grafana Cloud: Log in to your Grafana Cloud instance to access the Grafana dashboard interface.
- Navigate to Kubernetes Monitoring: Once logged in, navigate to the Kubernetes Monitoring section, usually found under the "Observability" or a similar menu.
- Select Alertmanager Alerts: Within the Kubernetes Monitoring interface, locate the section or menu that contains the available Alertmanager Alerts. This section provides a list of preconfigured alerts tailored specifically for Kubernetes clusters.
Explore Alert Categories
The available alertmanager alerts are categorized based on the specific Kubernetes metrics they monitor. Some common categories may include:
- Node Alerts: Monitors the health and performance of individual nodes within your Kubernetes cluster, including CPU usage, memory utilization, disk space, and network metrics.
- Pod Alerts: Focuses on the state and behavior of pods running in your cluster, including pod restarts, container crashes, resource consumption, and network connectivity.
- Cluster Alerts: Covers overall cluster health and potential issues, such as cluster component failures, persistent volume issues, and network connectivity problems.
- Workload Alerts: Monitors the performance and behavior of specific workloads, such as deployments, stateful sets, or daemon sets, including resource consumption, error rates, and availability.
Customize and Manage Alerts
Once you have identified the relevant alertmanager alerts for your Kubernetes environment, you can further customize them based on your specific monitoring requirements. Adjust threshold values, notification channels, and other parameters to align with your desired alerting criteria. You can also manage the lifecycle of alerts, enabling or disabling them as needed.
Grafana Cloud Cost Overview
When considering the cost of using Grafana Cloud for Kubernetes monitoring, it's important to understand the impact of metric usage. If you have a single node Kubernetes cluster, it typically generates approximately 14,000 or more metrics. However, Grafana Cloud Pro users already receive an allocation of 10,000 included metrics.
- If you have a single node Kubernetes cluster, it typically generates around 14,000+ metrics.
- Grafana Cloud Pro users receive an allocation of 10,000 included metrics.
- For Grafana Cloud Pro users with a single node Kubernetes cluster, you will be charged for the additional 4,000 to 5,000 metrics beyond the included allocation.
- This ensures cost optimization by only paying for the additional metrics you require.
- By utilizing the 10,000 included metrics, you can effectively manage and monitor your Kubernetes cluster without incurring extra costs for the initial metric usage.
- The actual number of metrics generated by your cluster may vary, so it's important to review your usage and pricing details provided by Grafana Cloud for accurate cost estimation.
- Understanding the cost implications and optimizing metric usage allows you to leverage Grafana Cloud efficiently while effectively managing your Kubernetes monitoring expenses.
Please note that the exact number of metrics generated by your Kubernetes cluster may vary, and it's recommended to review the actual usage and pricing details provided by Grafana Cloud to accurately determine the cost of your specific monitoring setup.
Conclusion
The Grafana Kubernetes Operator simplifies Kubernetes monitoring while enabling seamless integration with Grafana. Enabling the Kubernetes solution on Grafana Cloud enhances monitoring capabilities. The available Grafana dashboards and alertmanager alerts offer valuable insights. Understanding the Grafana Cloud cost overview helps optimize expenses. Leverage these tools to unlock the full potential of Kubernetes monitoring.
Resources
- https://grafana.com/docs/agent/latest/operator/helm-getting-started/
- https://grafana.com/docs/agent/latest/operator/architecture/
- https://grafana.com/docs/agent/latest/operator/api/
- https://grafana.com/docs/grafana-cloud/kubernetes-monitoring/configuration/
Eager to level up your game, check out my blog post on integrating OKE: End-to-End MongoDB Monitoring on Kubernetes: Integrating with Grafana Cloud for Comprehensive Insights
Hi! I am Safoor Safdar a Senior SRE. Read More. Don't hesitate to reach out! You can find me on Linkedin, or simply drop me an email at me@safoorsafdar.com
