How to Integrate Grafana Cloud with Ingress Nginx Controller
Integrate Ingress Nginx Controller with Grafana Cloud. Use specific dashboards to monitor performance and set up alerts for critical issues.

Optimize your Kubernetes monitoring with Grafana Cloud integration for Ingress Nginx Controller. Stay on top of performance.
As businesses rely more and more on Kubernetes for managing their containerized applications, monitoring and observability become crucial. One popular Kubernetes Ingress Nginx controller offers robust functionality for managing inbound traffic to Kubernetes clusters. To enhance the monitoring capabilities of Nginx, Grafana Cloud integration provides a powerful solution. In this blog, I will walk you through the process of integrating Ingress Nginx Controller with Grafana Cloud, enabling you to gain deep insights into your Kubernetes infrastructure.
Ingress Nginx Controller Integration Unavailable in Grafana Cloud
While Grafana offers a wide range of integrations and plugins to enhance the monitoring capabilities of users, the integration with the ingress nginx controller is not one of them. Despite this limitation, users can still implement monitoring for ingress nginx controllers in Grafana Cloud by employing alternative methods. One approach is to utilize Prometheus, an open-source monitoring and alerting toolkit. Grafana Cloud supports Prometheus, allowing users to collect and store metrics data from various sources, including ingress nginx controllers. Using Prometheus, users can create custom dashboards in Grafana Cloud to visualize and analyze the performance of their ingress nginx controllers, gaining valuable insights into their operation.
Implementing Monitoring for Ingress Nginx Controller
To enable monitoring for your Ingress Nginx Controller, you need to follow these steps:
Enable the metrics in the ingress controller
if you already have installed the ingress nginx controller, you can use the below command to update your ingress nginx controller
helm upgrade --install ingress-nginx ingress-nginx/ingress-nginx --namespace ingress-nginx --set controller.metrics.enabled=trueEnable the Ingress Nginx Controller Service Monitor:
To configure the Service Monitor for the Ingress Nginx Controller, use the following YAML:
apiVersion: monitoring.coreos.com/v1
kind: ServiceMonitor
metadata:
  name: ingress-nginx-monitor
  namespace: monitoring
  labels:
    instance: primary
spec:
  endpoints:
    - interval: 30s
      port: metrics
      metricRelabelings:
        - action: keep
          regex: nginx_ingress_controller_config_hash|nginx_ingress_controller_config_last_reload_successful|nginx_ingress_controller_ingress_upstream_latency_seconds_count|nginx_ingress_controller_ingress_upstream_latency_seconds_sum|nginx_ingress_controller_nginx_process_connections|nginx_ingress_controller_nginx_process_cpu_seconds_total|nginx_ingress_controller_nginx_process_resident_memory_bytes|nginx_ingress_controller_request_duration_seconds_bucket|nginx_ingress_controller_request_duration_seconds_count|nginx_ingress_controller_request_size_sum|nginx_ingress_controller_requests|nginx_ingress_controller_response_duration_seconds_bucket|nginx_ingress_controller_response_duration_seconds_sum|nginx_ingress_controller_response_size_bucket|nginx_ingress_controller_response_size_count|nginx_ingress_controller_response_size_sum|nginx_ingress_controller_success
          sourceLabels:
            - __name__
        - action: labeldrop
          regex: (id|uid|service|endpoint|metrics_path|name|pod_ip|owner_name|created_by_name)
      relabelings:
        - sourceLabels:
            - __metrics_path__
          targetLabel: metrics_path
        - action: replace
          replacement: integrations/kubernetes/ingress-nginx
          targetLabel: job

  namespaceSelector:
    any: true
  selector:
    matchLabels:
      app.kubernetes.io/component: controller
      app.kubernetes.io/instance: ingress-nginx
      app.kubernetes.io/name: ingress-nginx
Ingress NGINX Controller Dashboard
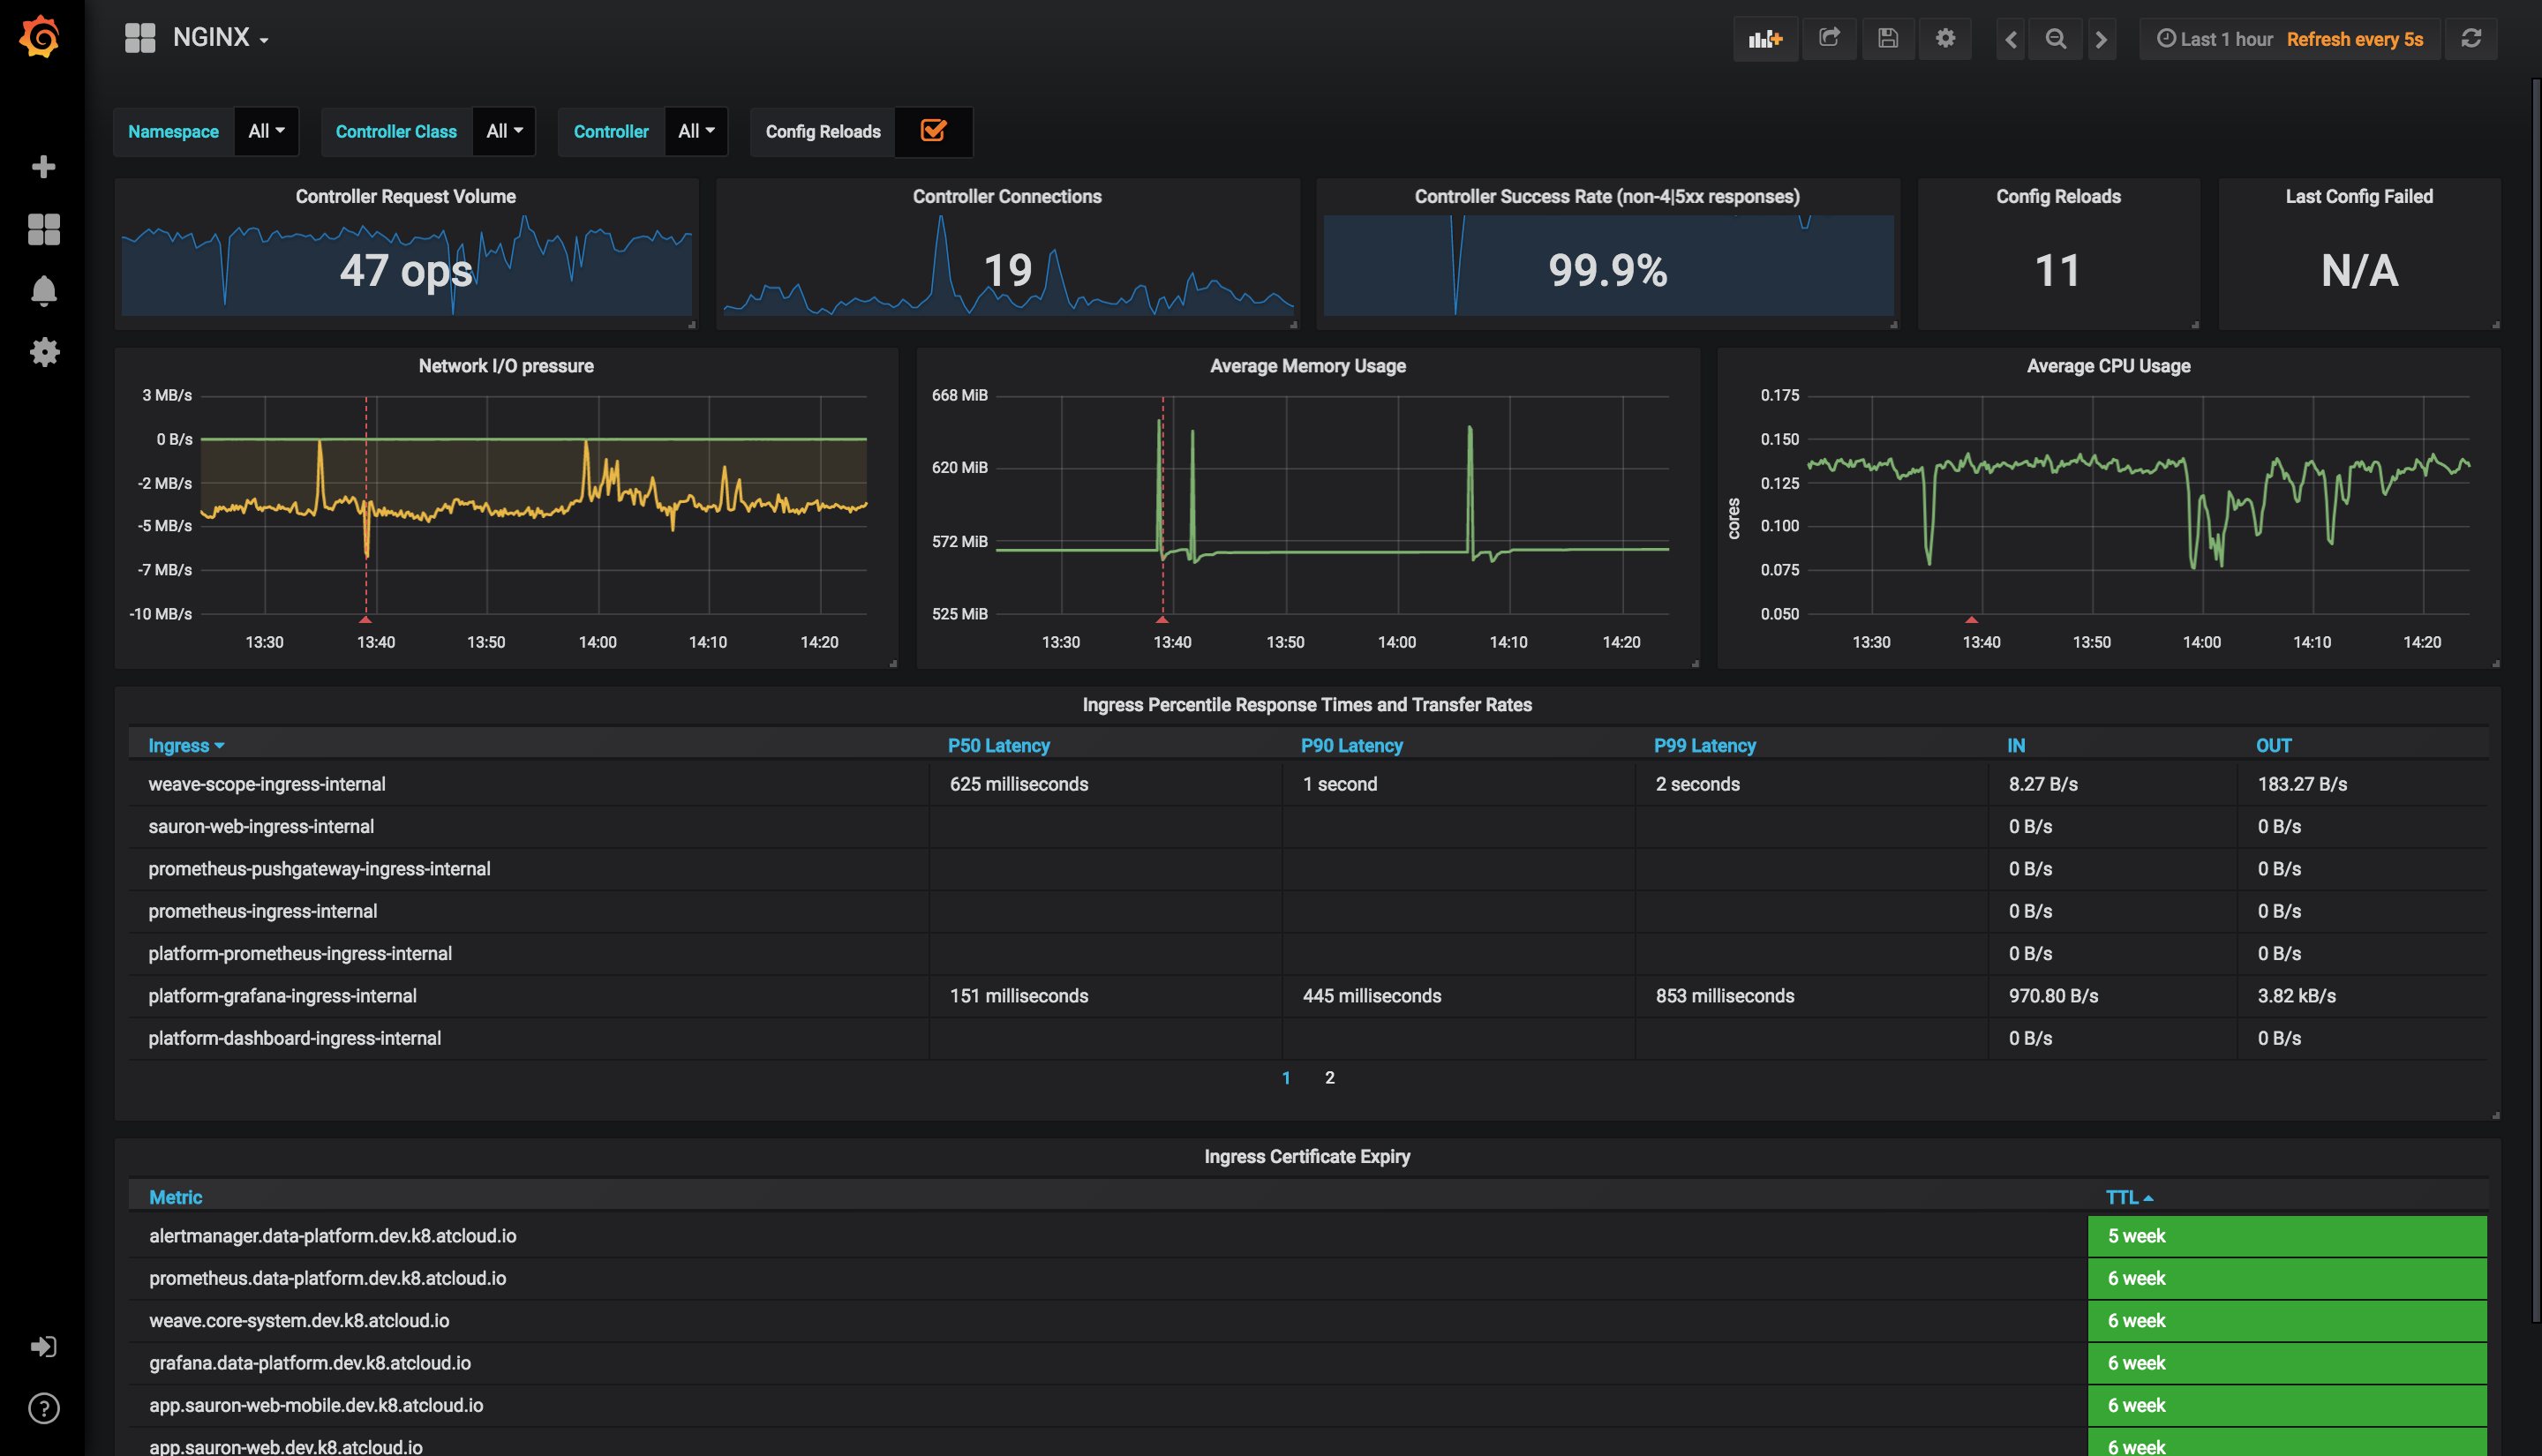
Grafana offers a collection of pre-built dashboards for the Ingress Nginx Controller, these dashboards provide valuable insights into the performance and health of your Ingress Nginx Controller.
Ingress-Nginx Controller

Features:
- Filter by Namespace, Controller Class, and Controller: Focus on specific namespaces or controllers to monitor individual performance.
- Shows request volume, successful requests, connections, and configuration issues.
- The coding monitors the network IO pressure, memory utilization, and CPU usage of the Ingress-Nginx Controller. It provides insights into resource utilization and identifies potential performance bottlenecks.
- The coding displays response time distribution statistics, including P50, P95, and P99 percentiles, and provides incoming and outgoing throughput metrics for effective performance analysis.
- The coding generates alerts for SSL certificate expiration, ensuring timely renewal and preventing service disruptions caused by the Ingress-Nginx Controller.
- Annotation overlays on the dashboard highlight configuration reload events, helping you correlate performance changes with Ingress-Nginx Controller updates.
Request Handling Performance

Features:
- Analyze Ingress-based performance metrics for detailed insights.
- Displays response time distribution statistics for overall request time and response time from upstream services, including the 50th, 95th, and 99th percentiles.
- Visualize request volume by path/URL to identify high-traffic areas and optimize performance.
- Track errors for each path to identify problematic paths that require investigation or optimization.
- Shows average response times for requests made to different paths, helping you identify slower paths and take appropriate action.
However, it's important to note that the provided dashboard lacks multi-cluster support, which is available in other Grafana Cloud integrations. To overcome this limitation, you can update the Grafana dashboard variables and widgets to include a cluster dropdown and filter based on it, allowing monitoring across multiple clusters.
List of Ingress Nginx Controller Alerts
Ingress Nginx Controller alerts can be configured in your monitoring system to proactively detect and notify you about potential issues with the Ingress Nginx Controller. By monitoring these metrics, you can ensure the smooth functioning of your Kubernetes applications and quickly address any problems that may arise. Here is a list of alerts for monitoring the Ingress Nginx Controller:
- NginxIngressControllerBackend4xxErrors
Description: High rate of 4xx errors from Ingress Nginx Controller backend
Criteria: The backend of the Ingress Nginx Controller is generating a high rate of 4xx error responses, indicating potential issues with backend services such as connectivity or configuration problems.
- NginxIngressControllerBackend5xxErrors
Description: High rate of 5xx errors from Ingress Nginx Controller backend
Criteria: The backend of the Ingress Nginx Controller is generating a high rate of 5xx error responses, indicating potential issues with backend services such as connectivity or configuration problems.
- NginxIngressControllerHighLatency
Description: Nginx request processing time in milliseconds is more than 10s
Criteria: The request processing time of the Nginx Ingress Controller exceeds 10 seconds, indicating potential performance issues.
- NginxIngressControllerHighRequestRate
Description: Nginx high request rate is greater than 2000 RPS (requests per second)
Criteria: The requested rate of the Nginx Ingress Controller exceeds 2000 RPS, indicating a high load on the controller.
Setting up Ingress Nginx Controller Alerts
Monitoring the Ingress Nginx Controller also involves setting up alerts to proactively identify potential issues. Here are some example alerts that you can configure:
This code snippet defines four alert rules for the Ingress Nginx Controller, including detecting high rates of 4xx and 5xx errors, high latency, and high request rate. These rules use Prometheus expressions to evaluate the relevant metrics and determine if the alert conditions are met. The severity, component, summary, and description are defined as labels and annotations to provide context and details about each alert.
namespace: integration-nginx-ingress-controller
groups:
  - name: nginx-ingress-controller-alerts
    rules:
      - alert: NginxIngressControllerBackend4xxErrors
        for: 5m
        expr: (sum by (ingress) (rate(nginx_ingress_controller_requests{status=~"4.."}[1m])) / sum by (ingress) (rate(nginx_ingress_controller_requests[1m]))) * 100 > 5
        labels:
          severity: critical
          component: nginx-ingress-controller
        annotations:
          summary: High rate of 4xx errors from Ingress Nginx Controller backend
          description: "The Ingress Nginx Controller's backend is generating a high rate of 4xx error responses, indicating issues with the backend services, such as connectivity or configuration issues."
      - alert: NginxIngressControllerBackend5xxErrors
        for: 5m
        expr: (sum by (ingress, cluster) (rate(nginx_ingress_controller_requests{status=~"5.."}[1m])) / sum by (ingress) (rate(nginx_ingress_controller_requests[1m]))) * 100 > 5
        labels:
          severity: critical
          component: nginx-ingress-controller
        annotations:
          description: "The Ingress Nginx Controller's backend is generating a high rate of 4xx error responses, indicating issues with the backend services, such as connectivity or configuration issues."
          summary: High rate of 5xx errors from Ingress Nginx Controller backend
      - alert: NginxIngressControllerHighLatency
        for: 5m
        expr: histogram_quantile(0.95,sum(rate(nginx_ingress_controller_request_duration_seconds_bucket[15m])) by (le,ingress)) > 10
        labels:
          severity: critical
          component: nginx-ingress-controller
        annotations:
          description: |-
            Nginx high latency
              VALUE = {{ $value }}
              LABELS = {{ $labels }}
          summary: Nginx request processing time in milliseconds is more than 10s
      - alert: NginxIngressControllerHighRequestRate
        for: 5m
        expr: sum(rate(nginx_ingress_controller_requests[5m])) by (ingress) > 2000
        labels:
          severity: critical
          component: nginx-ingress-controller
        annotations:
          description: |-
            Nginx high request rate
              VALUE = {{ $value }}
              LABELS = {{ $labels }}
          summary: Nginx high request rate is greater than 2000 RPS.
to apply these yaml files you need to install and configure mirtool cli. and example command would look like
mimirtool rules load ingress-nginx-alerts.yaml --address=https://prometheus-prod-01-eu-west-0.grafana.net --id=404168 --key=<admin key>By implementing these alert rules, you can effectively monitor the Ingress Nginx Controller for various issues and receive timely notifications to take appropriate actions.
Conclusion
By integrating Ingress Nginx Controller with Grafana Cloud, you can unleash the power of advanced monitoring and observability for your Kubernetes infrastructure. Despite the lack of native integration, the provided steps and configurations enable you to leverage Grafana's rich visualizations, analytics, and alerting capabilities. Stay on top of your Ingress Nginx Controller's performance and ensure the seamless operation of your Kubernetes applications with Grafana Cloud integration.
Remember, monitoring is an ongoing process, and it's essential to continuously fine-tune your dashboards and alerts to meet your specific requirements. With Grafana Cloud and Ingress Nginx Controller integration, you can effectively monitor, troubleshoot, and optimize your Kubernetes environment.
Hi! I am Safoor Safdar a Senior SRE. Read More. Don't hesitate to reach out! You can find me on Linkedin, or simply drop me an email at me@safoorsafdar.com
