
Optimizing Aurora MySQL Performance Monitoring with Custom IOPs CloudWatch Dashboards
In today's data-driven world, ensuring optimal database performance is crucial for maintaining smooth operations and delivering an exceptional user experience. As a Full Stack Developer or DevOps Engineer, one of the challenges you might face is effectively monitoring and analyzing the performance metrics of your Amazon Aurora MySQL instances. In this article, we'll walk you through the process of creating a custom CloudWatch dashboard tailored to monitor your Aurora MySQL I/O performance, including baseline I/O rates, peak I/O rates, and the duration of peak I/O activity.
Why Monitor Aurora MySQL I/O Metrics?
Amazon Aurora MySQL is a powerful relational database engine, but like any database, its performance can be affected by various factors, such as workload spikes, inefficient queries, or inadequate provisioning. Monitoring key I/O metrics helps you:
- Identify performance bottlenecks.
- Ensure that your database is operating within its performance thresholds.
- Take proactive measures to prevent issues before they impact your applications.
Setting Up CloudWatch Metrics for Aurora MySQL
Amazon CloudWatch allows you to monitor and visualize various metrics related to your Aurora MySQL instances. For this setup, we'll focus on three critical I/O metrics:
- Baseline I/O Rate per Hour
- Peak I/O Rate per Hour
- Duration of Peak I/O Activity (Hours per Month)
Let's dive into how we can set up these metrics in a CloudWatch dashboard.
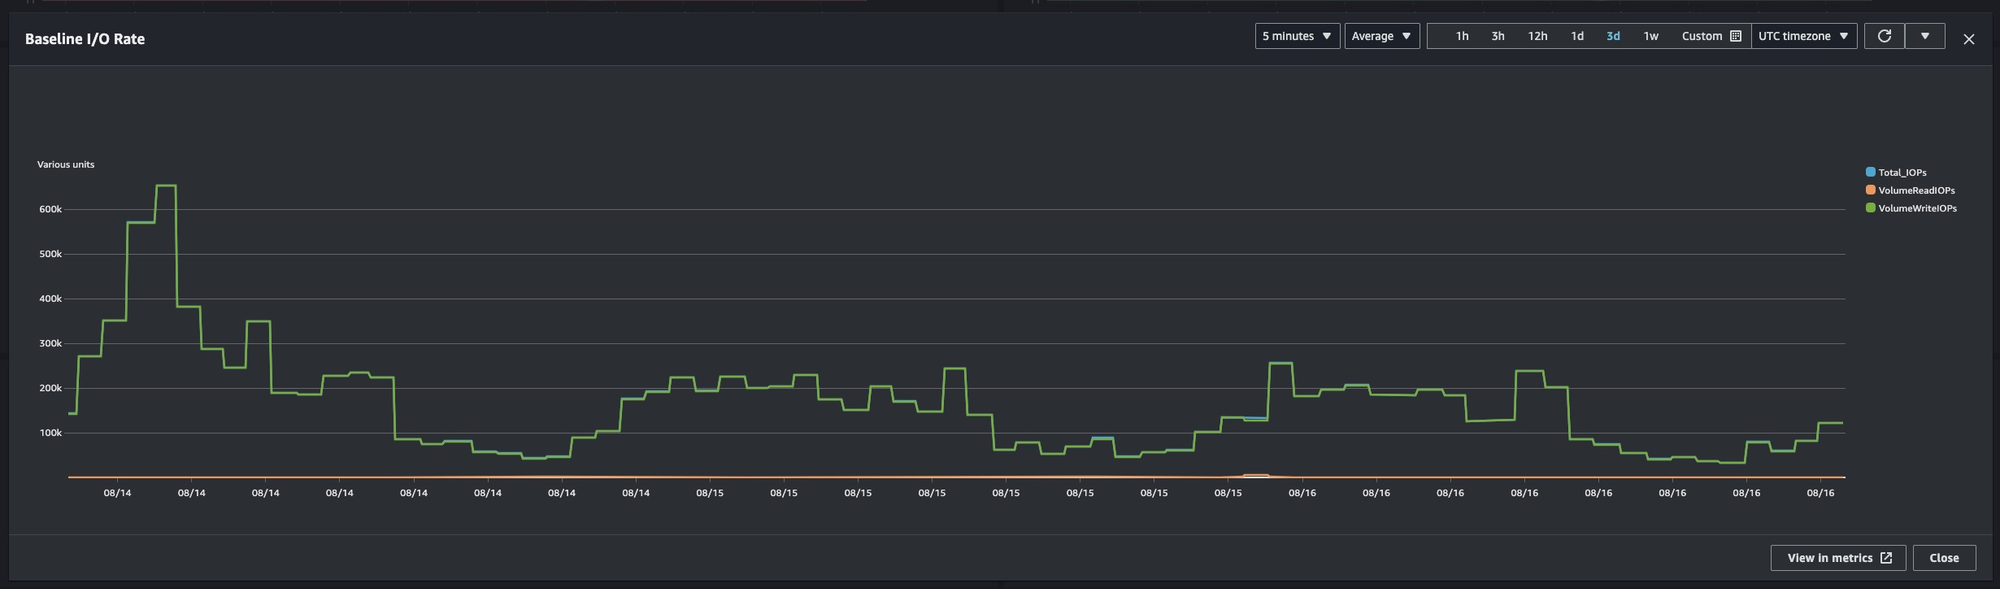
1. Baseline I/O Rate per Hour
The Baseline I/O Rate represents the average I/O operations per second (IOPS) your database performs under normal operating conditions. Monitoring this metric helps you understand your database's typical load and detect any deviations that might indicate performance issues.
Implementation:
To calculate the Baseline I/O Rate per hour:
- Aggregate the
VolumeReadIOPSandVolumeWriteIOPSmetrics over a 1-hour period. - Use the
AVGfunction to calculate the average IOPS for both read and write operations.
CloudWatch Metric Query:
{
    "metrics": [
        [ { "expression": "m1 + m2", "label": "Total_IOPs", "id": "e1", "region": "us-west-2" } ],
        [ "AWS/RDS", "VolumeReadIOPs", "DBClusterIdentifier", "db-production", { "id": "m1", "region": "us-west-2" } ],
        [ ".", "VolumeWriteIOPs", ".", ".", { "id": "m2", "region": "us-west-2" } ]
    ],
    "view": "timeSeries",
    "stacked": false,
    "region": "us-west-2",
    "title": "Baseline I/O Rate",
    "legend": {
        "position": "right"
    },
    "stat": "Average",
    "period": 60
}
This query provides a clear view of the average I/O rate per hour, helping you monitor the database's typical performance.
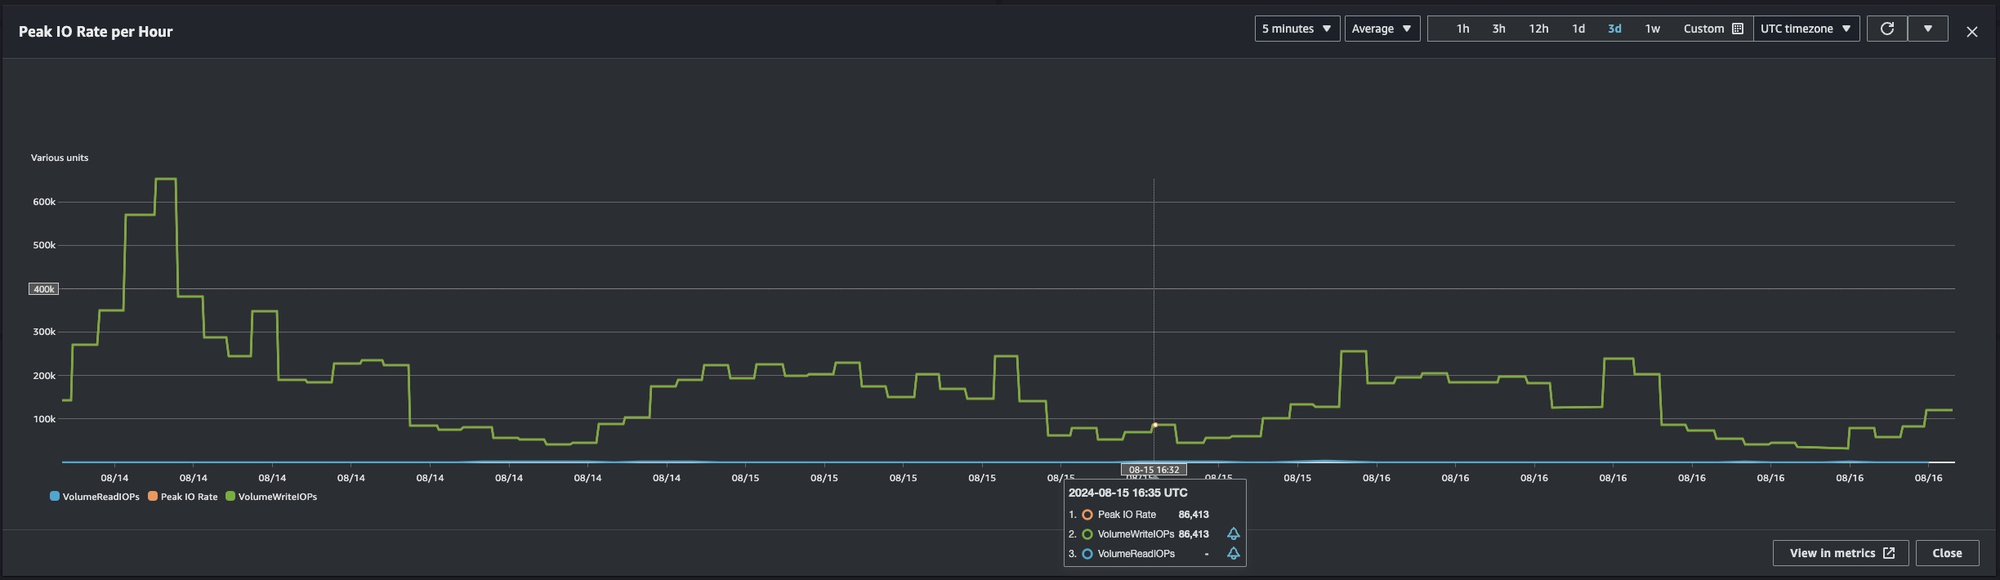
2. Peak I/O Rate per Hour
The Peak I/O Rate represents the highest IOPS your database experiences in a given hour. This metric is essential for understanding the maximum load your database handles and ensuring it doesn't exceed the allocated resources.
Implementation:
To calculate the Peak I/O Rate per hour:
- Similar to the Baseline I/O Rate, aggregate
VolumeReadIOPSandVolumeWriteIOPSmetrics. - Use the
MAXfunction to determine the maximum IOPS within each hour.
CloudWatch Metric Query:
{
    "metrics": [
        [ { "expression": "m1 + m2", "label": "Total_IOPs", "id": "e1", "region": "us-west-2" } ],
        [ { "expression": "MAX([e1])", "label": "MAX_IOPs", "id": "e2", "region": "us-west-2" } ],
        [ "AWS/RDS", "VolumeReadIOPs", "DBClusterIdentifier", "db-production", { "id": "m1", "region": "us-west-2" } ],
        [ ".", "VolumeWriteIOPs", ".", ".", { "id": "m2", "region": "us-west-2" } ]
    ],
    "view": "timeSeries",
    "stacked": false,
    "region": "us-west-2",
    "stat": "Average",
    "period": 60,
    "title": "Peak I/O Rate",
    "legend": {
        "position": "right"
    }
}
This metric helps you understand the maximum stress points for your database, allowing you to optimize resource allocation accordingly.
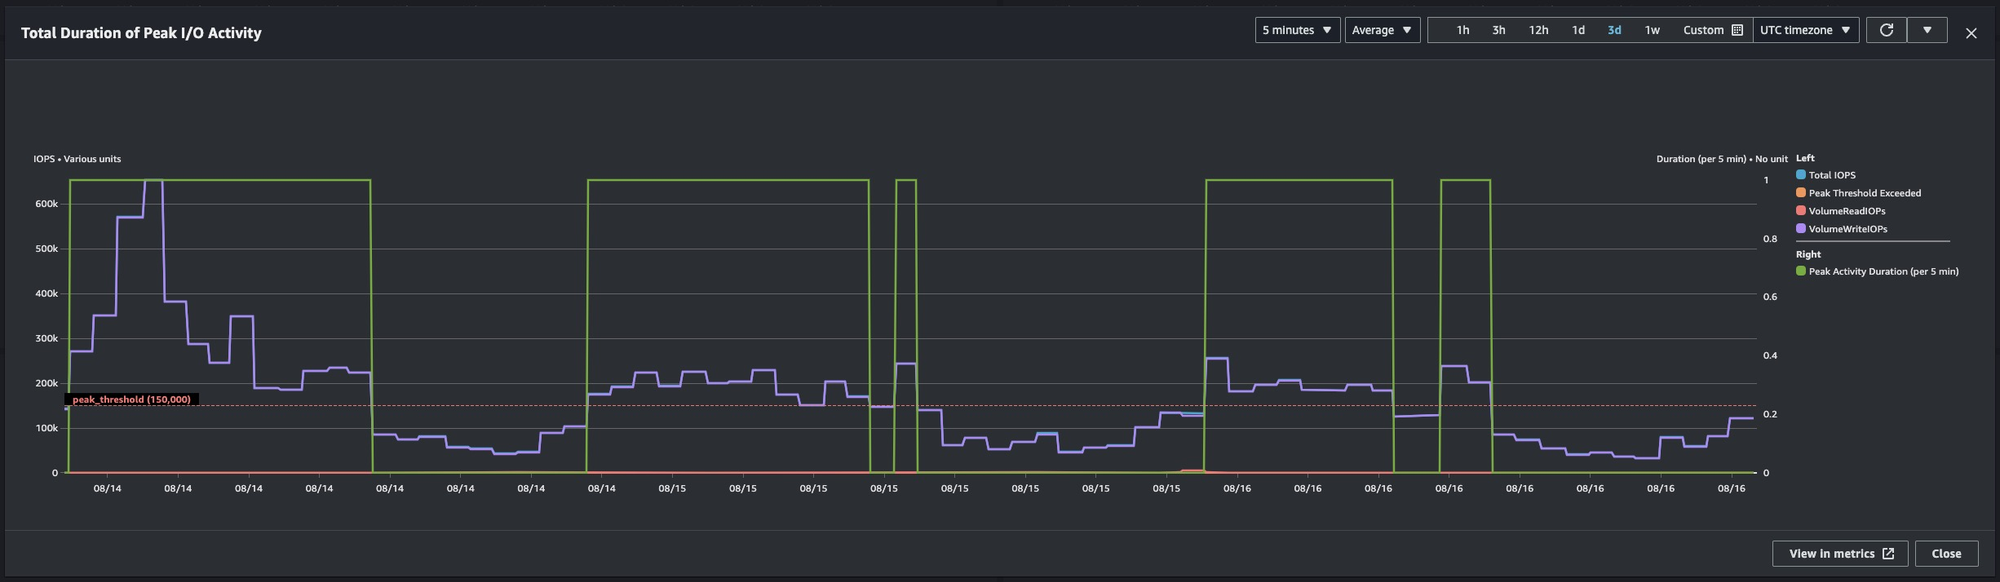
3. Duration of Peak I/O Activity (Hours per Month)
Understanding how long your database spends at peak I/O rates is crucial for capacity planning and performance tuning. This metric aggregates the duration of time your database I/O exceeds a defined threshold, providing insights into how often and for how long your database is under significant load.
Implementation:
To calculate the Duration of Peak I/O Activity:
- Define a peak threshold (e.g., 242,000 IOPS).
- Sum the periods when the IOPS exceeded this threshold and convert the result into hours for monthly aggregation.
CloudWatch Metric Query:
{
    "metrics": [
        [ { "expression": "m1 + m2", "label": "Total IOPS", "id": "e1", "region": "us-west-2", "yAxis": "left", "period": 300 } ],
        [ { "expression": "IF(e1 > 150000, 1, 0)", "label": "Peak Threshold Exceeded", "id": "e2", "region": "us-west-2", "yAxis": "left", "period": 300 } ],
        [ { "expression": "SUM([e2])", "label": "Peak Activity Duration (per 5 min)", "id": "e3", "region": "us-west-2", "yAxis": "right", "period": 300 } ],
        [ "AWS/RDS", "VolumeReadIOPs", "DBClusterIdentifier", "db-production", { "id": "m1", "region": "us-west-2", "yAxis": "left" } ],
        [ ".", "VolumeWriteIOPs", ".", ".", { "id": "m2", "region": "us-west-2", "yAxis": "left" } ]
    ],
    "view": "timeSeries",
    "stacked": false,
    "region": "us-west-2",
    "stat": "Average",
    "period": 300,
    "title": "Total Duration of Peak I/O Activity",
    "singleValueFullPrecision": false,
    "yAxis": {
        "left": {
            "label": "IOPS",
            "showUnits": true
        },
        "right": {
            "label": "Duration (per 5 min)",
            "showUnits": true
        }
    },
    "legend": {
        "position": "right"
    },
    "annotations": {
        "horizontal": [
            {
                "label": "peak_threshold",
                "value": 150000
            }
        ]
    },
    "setPeriodToTimeRange": false,
    "sparkline": true,
    "trend": true
}
This query sums the duration of peak I/O activity and converts it to hours per month, helping you assess how often your database operates under peak load conditions.
Creating and Visualizing the Dashboard
Once you’ve configured these metrics, you can add them to a CloudWatch dashboard for easy visualization. Here’s how:
- Create a New Dashboard: In the CloudWatch console, go to Dashboards and create a new one.
- Add Widgets: For each metric, add a new widget to the dashboard. Use the metric queries we discussed above.
- Customize the View: Adjust the period and labels for each widget to ensure the data is clear and actionable.
Monitoring Aurora MySQL I/O performance is vital for maintaining database health and ensuring optimal performance. By implementing a custom CloudWatch dashboard with the metrics we've discussed—Baseline I/O Rate, Peak I/O Rate, and Duration of Peak I/O Activity—you can gain deep insights into your database's performance patterns and take proactive measures to prevent issues.
This tailored approach to monitoring not only helps you maintain smooth operations but also empowers you to make informed decisions about capacity planning and resource allocation.
With this setup, you're well-equipped to handle the demands of your database infrastructure and deliver an exceptional experience to your users.
Feel free to customize the metrics further or add additional ones based on your specific needs. Happy monitoring!