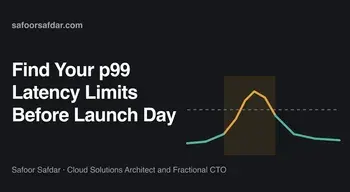
You have a launch, a marketing push or a large customer onboarding coming, and your team can’t say how many users the app can handle. At peak, a few requests start taking seconds, and the support queue fills up before the error rate moves. Before that date, I find the p99 limits using latency budgets, realistic traffic models, a check of common causes and a CI gate.
Key Takeaways
- Averages hide the slowest 1% of requests, so write down a p99 budget for each endpoint before you run any test.
- Test with an open model (a constant arrival rate), so coordinated omission can’t hide slow periods.
- Aim for 2x to 3x your forecast peak, because a launch forecast is an estimate made before real users arrive.
- At peak, connection pools, database IOPS and autoscaling capacity are common first failures, and CPU can look fine while they run out.
- Put p99 thresholds in CI so a release that breaks the budget fails the pipeline.
Why averages hide the real problem
Average latency hides the experience of your slowest users. p99 latency is the response time that 99% of requests beat. It describes the slowest 1% of requests, which at peak traffic can mean many users each minute.
Latency in web apps tends to have a long tail instead of a neat bell curve. Most requests hit warm caches and fast paths. A small group waits on a lock, a cold container, a garbage collection pause or a slow query. An average of 120 ms can sit on top of a p99 of 3 seconds, and the average moves little when the tail doubles. Your dashboards can show a healthy average on a normal Tuesday while that small group waits.
The tail compounds across a session. One page load can fan out into many API calls, and a user session contains many page loads. Each extra request raises the chance that at least one lands in the slow 1%. Your team can say “the API is fast on average” while customers say the app is slow, and both statements hold.
Sentry’s engineering team documented a case of this. A cold start problem in their workers affected roughly 5% of requests. With 5% of requests affected, the p99 lands inside the slow group and shows the full delay. The average blends it with the fast 95%. Fixing it took p99 latency on their RPC endpoints from 2.4 seconds to 176 milliseconds.
Setting latency budgets per endpoint
A latency budget is a written p99 target for each endpoint that matters, agreed before you test. Without one, you get numbers from a load test and no pass or fail decision.
Set budgets per endpoint type, because a login call, a search query and a PDF export carry different user expectations and costs. I group endpoints by how the user experiences them:
| Endpoint type | Example | Starting p99 budget |
|---|---|---|
| Interactive reads | Dashboard data, search | 300 to 500 ms |
| Interactive writes | Checkout, form submit | 500 ms to 1 s |
| Auth and session | Login, token refresh | 300 to 800 ms |
| Background or async | Exports, webhooks | Measured on queue time, not request time |
These numbers are my own starting points for a conversation with product, so adjust them to your users. Write them down next to an error-rate budget for the same endpoints.
If you already run SLOs, the latency budget should line up with your latency SLO. If you don’t, my post on why you should start with SLOs before hiring an SRE covers how to pick targets the business will defend.
Use an arrival rate instead of looping virtual users
A realistic load test reproduces the arrival rate, request mix and geography of your expected peak. If you get this wrong, the test measures a traffic pattern your users won’t produce. An open model sends requests at the rate real users would, even while your system is slow.
Many test scripts start a fixed number of virtual users that loop. Each one sends a request, waits for the response, then sends the next, which makes it a closed model. As the system slows down, each virtual user sends fewer requests, so the load drops at the moment it should rise. Your real users keep clicking while the server struggles.
Coordinated omission happens when the load generator waits on the system under test and skips requests it would have sent during a stall. Gil Tene popularized the term in his talk How NOT to Measure Latency. Your percentiles leave out the slow periods, and your p99 looks healthy because the test stopped measuring when things went wrong.
An open model fixes this, because requests arrive at a fixed rate whether or not earlier ones have finished. In k6 that’s the constant-arrival-rate executor. It starts iterations at the rate you set, as long as VUs are available.
The k6 example below holds 200 iterations per second for 10 minutes. Each iteration makes two requests, so the test sends about 400 requests per second. The run fails if any endpoint’s p99 or error rate goes over budget.
import http from 'k6/http';
import { check } from 'k6';

const BASE_URL = __ENV.BASE_URL || 'https://staging.example.com';

export const options = {
  scenarios: {
    peak_traffic: {
      executor: 'constant-arrival-rate',
      rate: 200,
      timeUnit: '1s',
      duration: '10m',
      preAllocatedVUs: 200,
      maxVUs: 1000,
    },
  },
  thresholds: {
    http_req_failed: ['rate<0.01'],
    'http_req_failed{name:search}': ['rate<0.01'],
    'http_req_failed{name:checkout}': ['rate<0.01'],
    'http_req_duration{name:search}': ['p(99)<500'],
    'http_req_duration{name:checkout}': ['p(99)<1000'],
    dropped_iterations: ['count<1'],
    checks: ['rate>0.99'],
  },
};

export default function () {
  const search = http.get(`${BASE_URL}/api/search?q=shoes`, {
    tags: { name: 'search' },
  });
  check(search, { 'search is 200': (r) => r.status === 200 });

  const payload = JSON.stringify({ sku: 'SKU-123', qty: 1 });
  const checkout = http.post(`${BASE_URL}/api/checkout`, payload, {
    headers: { 'Content-Type': 'application/json' },
    tags: { name: 'checkout' },
  });
  check(checkout, { 'checkout is 200': (r) => r.status === 200 });
}
Durations in k6 thresholds are in milliseconds. The name tag groups requests per endpoint, so each one gets its own latency budget and error threshold. I left out a global duration threshold on purpose, because it would mix both endpoints into one percentile and blur the per-endpoint budgets.
The dropped_iterations threshold catches the case where k6 ran out of VUs and couldn’t hold the target rate. Without it, k6 would fall below the target rate without failing, and your open model would turn into a weaker test. The checks threshold fails the run unless more than 99% of check() calls pass, so failed status checks fail the run too.
Size preAllocatedVUs at the rate multiplied by the expected iteration time, so k6 doesn’t allocate VUs mid-test. If each iteration takes about one second, 200 iterations per second needs 200 VUs, which matches the example. maxVUs gives k6 room to add VUs when iterations slow down under load.
Model the request mix, data and regions
The arrival rate sets how often requests arrive, and the rest of the model sets what those requests do:
- Mix. Take the ratio of reads to writes and the top endpoints from production logs or your APM.
- Data shape. Test against a dataset close to production size. A query that’s fast on 10,000 rows can fall over on 50 million.
- Cache state. Run at least one test with cold caches. A deploy or a cache flush on launch day leaves you with cold caches too.
- Regions. Generate load from more than one region if your users are spread out. A test run from one region next to your cluster hides TLS handshake costs, CDN misses and cross-region database calls.
- Shape over time. Add a ramp scenario (k6 has
ramping-arrival-rate) next to the flat plateau to see how autoscaling reacts.
Target 2x to 3x your forecast peak. A launch forecast is an estimate made before real users arrive, and the headroom gives you time to react on the day.
Shared resources that break first at peak
Apps that fail at peak hours tend to run out of a shared resource, such as connections or IOPS, before CPU. These are the ones I check first:
| Cause | What you see | Where to look |
|---|---|---|
| Connection pool exhaustion | p99 climbs in steps, then timeouts, while the database looks idle | App pool wait time, DB connection count |
| N+1 queries | Latency grows with data size, query count per request is high | APM traces, query count per request |
| GC pauses | Periodic spikes across all endpoints at once | Runtime GC logs and pause metrics |
| Noisy neighbors | Spikes that do not match your own traffic | Node-level CPU steal, shared DB or cache metrics |
| Cold starts | Slow first requests after scale-out or deploy | New pod or function start time, readiness timing |
| Autoscaling lag | Latency spikes for minutes after traffic rises, then recovers | Time from metric breach to ready capacity |
| Database at its IOPS limit | Write latency and queue depth rise together | Disk queue depth, read and write IOPS against provisioned limit |
Autoscaling lag can leave you under-provisioned for several minutes. Your monitoring scrapes metrics on an interval, and the scaler acts on an average of those samples. New nodes take time to join, and new pods need time to warm up. Pre-scale before a known launch instead of trusting the scaler to catch a sudden step change.
On Amazon RDS, the IOPS ceiling comes from the storage type and size you provisioned. The instance class can cap it lower, so check both. On Aurora, watch volume IOPS alongside instance throughput. I wrote about building CloudWatch dashboards for Aurora IOPS for this reason.
If you run Prometheus, you can watch p99 per route during the test with histogram_quantile:
histogram_quantile(
  0.99,
  sum by (le, route) (rate(http_request_duration_seconds_bucket[5m]))
)
Your instrumentation library decides the metric name and the route label, so adjust both to match your setup. The query returns seconds while the k6 budgets are in milliseconds, and a [1m] window tracks a 10-minute test with less smoothing than [5m].
The result is an estimate interpolated from bucket boundaries. If your buckets jump from 1 s to 5 s, the reported p99 can land far from the real value. Put bucket edges near your budgets.
Gating releases on p99 in CI
A p99 gate in CI makes each release candidate pass your latency budget before it ships. You catch regressions while the change is small and its author still remembers it.
k6 exits with a non-zero code when a threshold fails, so most CI systems fail the job without extra scripting. A workable setup looks like this:
- Deploy each release candidate to a staging environment with production-like sizing.
- Run a short arrival-rate test (5 to 10 minutes) at your normal peak rate.
- Fail the pipeline if p99 or error rate breaks the budget for any tagged endpoint.
- Run the full 2x to 3x peak test on a schedule and before every planned launch.
Shared staging environments are noisy, so give the gate some tolerance and judge trends across several runs instead of a single result. Keep the thresholds in the repo next to the test, so a budget change goes through code review like any other change.
My approach before a launch
I start with production data. I pull the real request mix, the busiest endpoints and their current p99 from monitoring. Then I agree budgets with the product owner and write the k6 scenarios last.
At IDWise, an identity verification SaaS, k6 load tests found the bottlenecks that gave 3x traffic headroom. I also helped the team move from a serverless architecture to containers on Kubernetes, and the platform held a 99.95% uptime SLA.
At Niche Academy, an EdTech platform, we raised requests-per-second throughput and cut unplanned outages by 90%. Monitoring matters as much as tuning in work like this, because it shows you the next limit before users hit it.
At Systems Limited, I consulted for Telenor, deploying production Kubernetes, building Prometheus and Grafana monitoring and running chaos experiments.
You can read about my background in cloud reliability or see more of this history on my experience page.
A launch readiness checklist
You’re ready for launch day when you can point to evidence for each row below.
| Check | What “done” looks like |
|---|---|
| Latency budgets per endpoint | A written p99 target and error-rate budget for each endpoint that matters, agreed with product before testing |
| Arrival-rate test at a stated peak multiple | An open-model test (constant arrival rate) at 2x to 3x your forecast peak, with no dropped iterations |
| Thresholds wired into CI | k6 p99 and error-rate thresholds per tagged endpoint, kept in the repo and failing the pipeline on a breach |
| Tests from more than one region | Load generated from more than one region when your users are spread out, not only next to your cluster |
| Dashboards and alerts on p99 | p99 per route on a dashboard, histogram bucket edges near your budgets, and an alert when p99 goes over budget |
Frequently asked questions
What is p99 latency?
p99 latency is the response time that 99% of requests complete within. The slowest 1% take longer than that value. It’s a better guide to user experience at peak than the average, because it shows the tail where problems first appear.
How many users can my app handle?
A load test gives you the answer as requests per second at a given p99, which is more useful than a user count. Find your peak arrival rate from production data, then test with an open model at 2x to 3x that rate. The highest rate that stays inside your p99 and error budgets is your capacity.
Why does my app go down at peak hours when CPU looks fine?
A shared resource such as database connections, IOPS, a thread pool or cache capacity tends to run out before CPU does. Autoscaling lag and cold starts make it worse, because new capacity arrives minutes after the spike. Check pool wait times and database queue depth before adding more servers.
How do I reduce API latency at p99?
Find the cause before tuning. Trace the slowest requests and look for N+1 queries, pool waits, GC pauses and cold starts. Fix the biggest contributor first. Then add a p99 threshold in CI, so a later release can’t undo the fix without failing the pipeline.